Simulation of cell numbers
The simulations from the previous section can be repeated quickly and often with an app.
This way you can focus your attention on the statistical questions.
| 5.3a | A simulation with the example from the previous paragraph. With question and answer. |
![]()
| 5.3b | A simulation with a sample in which all numbers are 10x as big With question and answer. |
![]()
Results
The simulations are sampling without reverting from the margins of a perceived sample.
Each simulation gives a cross-table, a selected cell indicates the number of dots in the distribution chart.
This distribution chart is an overview of all possible outcomes and how often they occur.
The distribution graph is symmetrical and clockwise. The center is the average and the expected number of the cell.
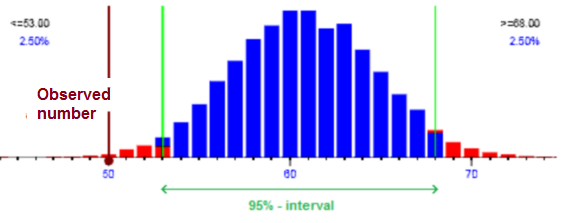
In a 2x2 table, the four centers of the distribution graphs of each cell are exactly the perfect table.
In general, values from the 95% interval are considered acceptable. That is, matching the perfect table that indicates that the variables are not (statistically) related.
An observed value beyond the 95% interval can hardly be a coincidence. Such a perceived value indicates that the variables are most likely to have a (statistical) relationship. The variables show cohesion and are therefore dependent.