Simulation of Chi-squared
The Chi Square is a widely used measure to draw conclusions from 2x2 cross tables.
At the chi square you get a different kind of distribution graph
5.4 An assignment with table of 5.3 a but then for the chi-squared.
With question and answer.
![]()
| 5.4b | Assignment with table of 5.3b but then for the chi square. |
With question and answer
![]()
Results
The simulations are samples without redraw from the marginals of a perceived sample.
Each simulation indicates a cross table, the Chi square indicates a dot in the distribution chart.
A distribution chart is an overview of all possible outcomes and and the extent to which they occur. .
The distribution graph is non-symmetrical and descending to the right.
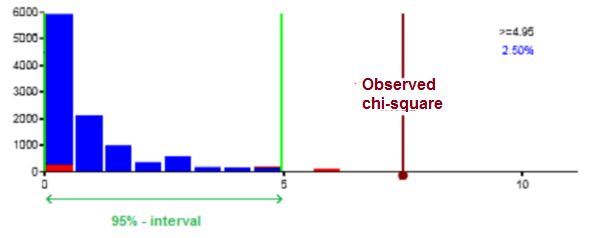
In general, values from the 95% interval are considered acceptable. That is, matching the perfect table with a chi square equal to 0. This indications that the variables do not have a (statistical) relation.
If A observed Chi Square is far from 0, it is likely that there may be a correlation between the variables. At A chi square that is beyond the 95% interval, that can hardly be any coincidence. Such a perceived value indications that the variables are most likely to have a (statistical) relationship. The variables show cohesion and are therefore dependent.
Remarkably, the 95% interval begins immediately after 0.
The area beyond the 95% interval is left and right. On the left it is quite narrow.
Observed values of chi-square indicate dependence in the right-hand outer area.