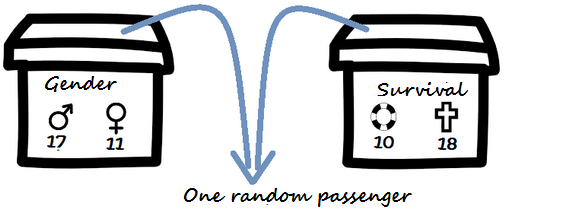
This paragraph aims to see which steps the simulation consists of. The starting point is a small sample sample with the cross-table below.
|
Survival |
||
Gender |
rescued |
died |
total |
male |
5 |
12 |
17 |
female |
5 |
6 |
11 |
total |
10 |
18 |
28 |
This is the table of the observed data.
The margins are in a colored background
|
Survival |
||
Gender |
rescued |
died |
total |
male |
|
|
17 |
female |
|
|
11 |
total |
10 |
18 |
28 |

This is the table with only the margins.
The cells are filled according to the simulation diagram below.
The gender and survival is known for the simulated passenger. That yields a peat in one of the four cells of the table.
After 28 of these "double" drawbacks, the boxes are empty and one sample is simulated (resampled).
The corresponding simulated cross table has now got certain cell numbers. This allows you to calculate a relative risk or the chi square. Then you can put the found chi square as a dot in a dot plot. After many repetitions of the simulation, that dot plot gives an image of the division of simulated chi-square in the case of independence.
5.1a How big is the minimum and maximum number of each cell?
5.1b How big is the minimum value of the chi square?