In a disaster scenario, 100 passengers are involved, 70 men and 30 women.
40 passengers survived the other 60 died.
In the crosstab below, these numbers are the totals (margins).
The 2x2 table consists of two category variables, Gender and Survival.
The numbers in the cells are not known, you can think of multiple possibilities.
.
|
Survival |
||
Gender |
Survived |
Died |
Total |
Male |
|
|
70 |
Female |
|
|
30 |
Total |
40 |
60 |
100 |
Make sure your table can be filled in completely if the number of only one cell is known.
| 4.1a | Assume that as many women as men were saved. |
| Calculate the numbers in the other cells. Then open the table. |
![]()
Of all the ways in which you can fill in the table, there is exactly one that exactly matches the margins
The percentages of the rows, the group of men and the group of women are then the same as the percentages in the last row.
The percentages of the columns, the group survived and the group dead passengers are the same as the percentages in the last column.
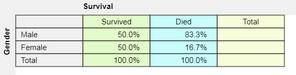
If the percentages for the categories and the borders are the same, the crosstab is called
a perfect table.
The variables then do not have coherence and are called independent.
The numbers in the cells of a crosstab of data are the observed frequencies.
The numbers in the cells of a perfect table are called the expected frequencies.
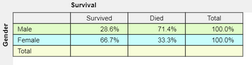
Because here the table total is 100, you actually see percentages. Thus, 70% of the saved group is male and 40% of men are saved. Because these percentages also apply to the columns and rows, the cell Male-Survived has a number of 40% of 70% of 100 thus 28.
|
Survival |
||
Gender |
Survived |
Died |
Total |
Male |
28 |
42 |
70 |
Female |
12 |
18 |
30 |
Total |
40 |
60 |
100 |
The perfect table with the expected frequencies.
Expected frequencies can be calculated using the border percentages or the border totals.
![]()
In the app, you can choose the Perfect Table option. You will then see the frequencies of a crosstab with the expected frequencies.
| 4.1b | Find out how the charts of a perfect table look. |
![]()
| 4.1c A scenario with variables Gender and Survival are the data in a crosstab. |
| Find out whether the variables have coherence. |
![]()
| 4.1d | A scenario with variables Gender and Survival are the data in a crosstab. |
| Find out whether the variables have coherence. |
![]()
The perfect table, which is important for evaluating a crosstab, will return later in this chapter