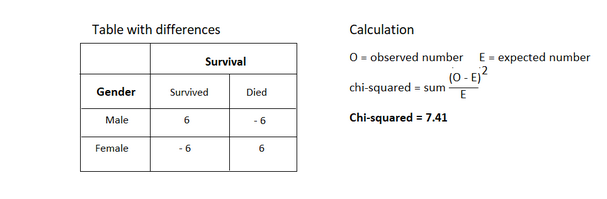
A measure that takes into account the differences between the observed numbers in the sample table and the expected numbers in the perfect table is the chi square. This measure can be compared to the square of the standard deviation. The variance is about the deviations of the mean in one variable. The chi square is a measure of the deviations between the observed and expected numbers in the cells in two variables.
The calculation is simple but for tables with more than two rows or columns time-consuming to calculate without software.
Sample tables (observed frequencies) and Perfect Tables (expected frequencies)
|
|
|
||||||||||||||||||||
4.3a Why are the absolute differences all equal? 4.3b How does the chi square change if the differences increase and the totals do not? 4.3c The observed frequencies double. Do the expected frequencies stay the same? 4.3d Calculate the Chi-square of the table below.
In a situation where the observed numbers are equal to the expected numbers, the Chi Square is equal to 0. Explain that. |
|
|
||||||||||||||||||||
|
|
|
||||||||||||||||||||
|
|
|
|
|
|
|
|
|